
|
PENCE / CIHR-Group
|

|
Funding for this software has been provided in part by the
Canadian Institutes of Health Research (CIHR Group)
and the
Protein Engineering Networks of
Centres of Excellence (PENCE).
|
|
PENCE / CIHR-Group
|
|
Funding for this software has been provided in part by the
Canadian Institutes of Health Research (CIHR Group)
and the
Protein Engineering Networks of
Centres of Excellence (PENCE).
|
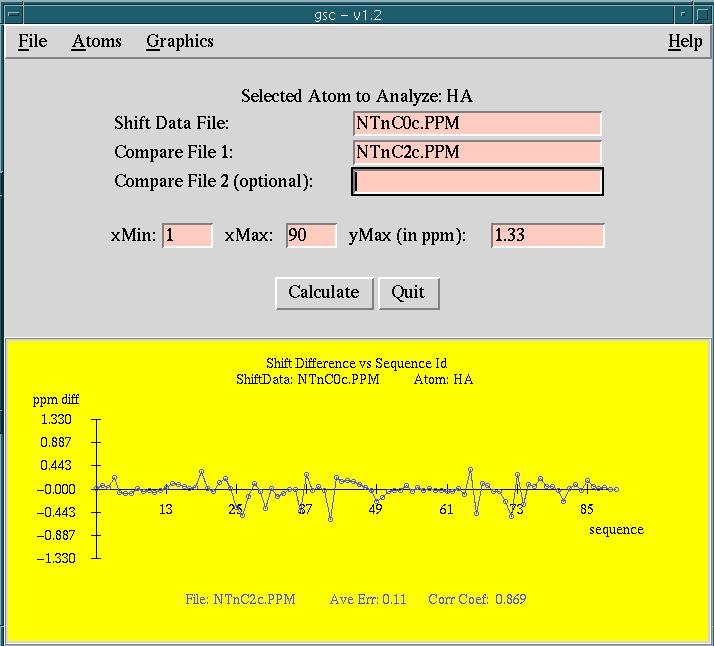
Version: 1.2 - Dec 2002 Purpose: gsc is a tcl/tk program which makes it easy to analyze chemical shifts of selected atoms between chemical shift files. |
The user enters shift data for sequences which are identical or highly
homologous. The user then selects the atom type (eg, hn, ha, ca, etc) and
the region of the sequences to study. The program draws a line graph
depicting the difference in shifts between the sequences. The user can
then save the plot to a postscript file.
Copyright (C) 1999 -
No portion of this program may be incorporated into other
programs or sold for profit without express written consent
of the authors.
PC(Linux): gsc v1.2 (0.91 MB)
Once you have downloaded the software, you then proceed by
uncompressing and untarring the files. For example:
Data files for the example displayed in the
screen snapshot
are found in the INSTALL_LIB/gsc/examples directory.
Verification of amino acid codes and atom names is not done by gsc,
however it is important for amino acid ID codes to be ordered from
lowest to highest.
Only shifts which have the same shift name
can be compared! Please note the implications of this statement:
As a final note, it is possible to input shift data where the name and
value fields are not necessarily the first and second fields respectively.
The user can set the fields via the "Shift Data Format" FILE menu option.
One particular application of this is for a program called
orb which has
valid shift values of interest in the 4th field as well.
Example PPM shift files should be available in INSTALL_DIR/lib/gsc/examples.
If you do not get a graphical window, check with your system administrator
to make sure the program has been installed and is accessible to you.
If you customize the colors, fonts, size, etc of the window, these changes
will be saved in your $HOME/.gsc file.
Once the shift data file is entered, gsc will take a few seconds to
read the shifts. It will display the sequence IDs of the first and last
shifts read in the "xMin" and "xMax" fields respectively.
The user can compare the shifts in the above data file to one or two
other sets of shift data.
This option is useful if you want to compare amino acids in a
specific range of your sequence.
Remember to press return after changing a number.
Click and hold the mouse down and move the cursor to hilite the
atom of choice.
The program calculates the shift differences. Understanding and
saving the output is dealt with in the next two sections.
A line connecting any two ovals or rectangles represents
consecutively numbered amino acid ID numbers.
If you are looking to change colors of certain fields, a list of valid color
names can be found in $OPENWINHOME/lib/rgb.txt or try
/usr/X11R6/lib/X11/rgb.txt. Ask your system administrator.
The program has put the graph text in default areas. You can move
any text by holding down the leftmost mouse button over the text
and drag it to the area you wish. This may be useful when the text
and graph lines overlap.
Fonts for the graph can be changed via the
fonts GRAPHICS menu item.
When selecting a font, it is desirable to select a postscript font
available on your laser printer. Use the Save plot FILE menu
option to save your plot to a postscript file.
It can be very insightful to look at specific atom shift
differences for amino acids in greater detail.
The numeric shift differences that gsc has plotted
can be viewed via the "show output..." FILE menu option.
The user can also choose to save copies
of the output files by selecting the "Save output..."
FILE menu option.
The shift differences are printed one per line, and if more than 1
atom match is found in a given amino acid, then the average difference
for that amino acid is also printed.
We felt that having more than two compare files would make it hard to read the
graph. If the user really wants to depict several shift file comparisons on
the same graph, you may be able to input the numeric output files
into some other graph fitting package.
Do not edit the ./gscDefaults file directly because it is overwritten
whenever you run gsc and make a change to your options. If the user
does not have ./gscDefaults, the program will use the default
file from INSTALL_DIR/lib/gsc/gscDefaults.
The shift name field has no blank characters and amino
acids are expected to have ResId's which are ordered
from lowest to highest.
A shift value field is specified as a either a real number or
with asterisks '*' to denote unknown values. The value "-999.99"
or "999.99" is also understood by several programs to mean an unknown value.
Here is an example of a typical PPM shift file:
This file last updated:
Questions to:
bionmrwebmaster@biochem.ualberta.ca
Copyright and Acknowledgements
Wolfram Gronwald ,
R. Boyko,
and B.D. Sykes.
GSC: a graphical program for NMR chemical shifts comparison
CABIOS Vol. 13 no. 5 557-558 (1997)
Download
Select the version of gsc corresponding to your operating system.
Solaris: gsc v1.2 (1.04 MB)
SGI(Irix6.5): gsc v1.2 (1.50 MB)
Installation
	> uncompress gsc-v1.2-sgi6.tar.Z
	> tar xvf gsc-v1.2-sgi6.tar
	> cd gsc-v1.2-sgi6
Look at the README file for details on installation.
> more README
It is pretty simple, all you have to do is know where you want to
put the executables and where to put the documentation, library and
example files. The installation script prompts you for
the names of these directories.
> ./Install
Finally you can test the program by going to the directory where the
program is installed and type the name. The README file also explains
how to set your path environment variable to include the location
of the executable.
Input Data Files
The gsc program can only read shift files which are in
PPM format.
Basic Program Usage
Understanding the Output
Customizing the Graph
The following settings are available under the GRAPHICS menu item.
All changes are saved to the users's ./gscDefaults file.
A user can re-acquire the default settings by simply getting
rid of this file.
Output Difference Files
Final Comments
Appendix 1: PPM Formatted Shift Files
The following rules define a shift file in PPM format:
For example, 1:GLU_95:HB1 has molecular Number = 1,
Amino acid = GLU, Amino acid ID number = 95, and atom name = HB1
molNum:Residue_ResId:atom
where
	molNum = Molecular Number (an integer)
	Residue = Amino acid in 3 letter code (character string)
	ResId = Amino acid ID number (an integer)
	atom = Atom name (character string)
!
!Sequence: ADQ
!
1:ALA_1:N           ***.**
1:ALA_1:C           174.00
1:ALA_1:CA           51.90
1:ALA_1:CB           18.80
1:ALA_1:HN          ***.**
1:ALA_1:HA            4.15
1:ALA_1:HB#           1.57
1:ASP_2:N           120.50
1:ASP_2:C           175.80
1:ASP_2:CA           54.70
1:ASP_2:CB           41.20
1:ASP_2:HN          ***.**
1:ASP_2:HA            4.67
1:ASP_2:HB1           2.72
1:ASP_2:HB2           2.60
1:ASP_2:CG           **.**
1:ASP_2:HD2           *.**
1:GLN_3:N           119.60
1:GLN_3:C           175.80
1:GLN_3:CA           55.70
1:GLN_3:CB           30.20
1:GLN_3:HN            8.24
1:GLN_3:HA            4.42
1:GLN_3:HB1           2.12
1:GLN_3:HB2           2.00
1:GLN_3:CG           33.70
1:GLN_3:HG1           2.38
1:GLN_3:HG2           2.38
1:GLN_3:CD          180.00
1:GLN_3:NE2         ***.**
1:GLN_3:HE21          7.37
1:GLN_3:HE22          6.71