 |
Sykes NMR Software Centre |
 |
Funding for this software has been provided by the
Canadian Institutes of Health Research (CIHR Group)
| |
Sykes NMR Software Centre |
|
Funding for this software has been provided by the
Canadian Institutes of Health Research (CIHR Group)
Version: 1.0 - Sep 29/06
|
This software was developed to integrate a series of spectral data files. Our data was obtained on the fluorimeter, however any two column coordinate data input is all that is required. The impetus for this software arises from the lack of our spreadsheet programs to provide the required functionality.
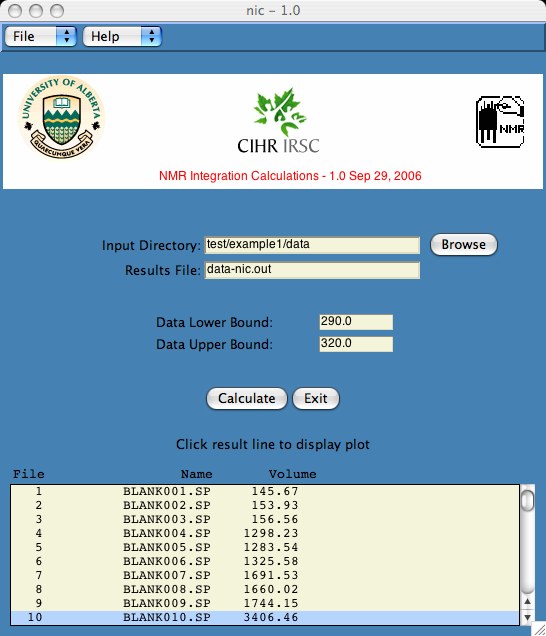
The advantage of the program is that one can load all the data files simultaneously, integrate over boundaries chosen by user, and then step through plots quickly and easily to verify data integrity. The ease of doing this should be worth the effort in learning the software.
Granted that our spectral analysis consists of integration only, but the possibilities of adding other mathematical calculations are interesting. This software provides a good template for other adhoc data analysis.
Wish is an interpreter that takes Tcl/Tk scripts and creates the GUI widgets. You can type whereis wish or which wish to verify that you have the program. If you cannot find wish, you may have to download and install tcl/tk which is public domain software.
	> tar xvf nic-1.0.tar
	> ls
		nic-1.0
	> cd data
	> ls
		BLANK001.SP     BLANK004.SP     BLANK007.SP     BLANK010.SP
		BLANK002.SP 	BLANK005.SP     BLANK008.SP     BLANK_P.SP
		BLANK003.SP 	BLANK006.SP 	BLANK009.SP
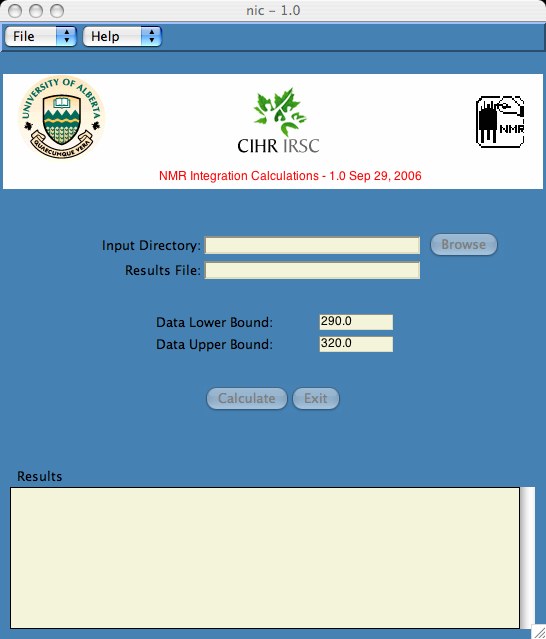
	> cd nic-1.0
	> wish nic.tcl
The area calculation begins at the first point which is >= the lower bound. The area calculation ends at the last point which is <= the upper bound. If this is problematic, I will leave it to you to change it in the nic.tcl file.
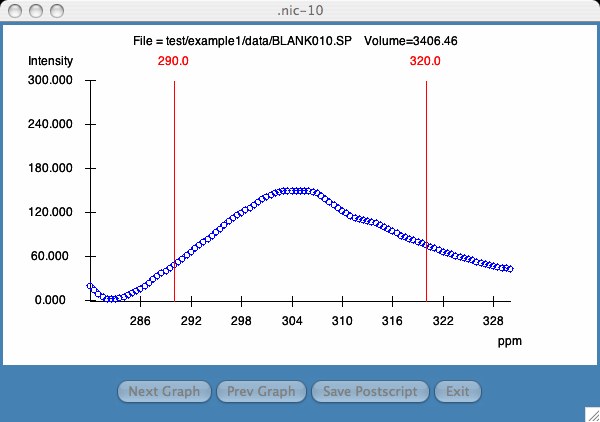
The Next Graph and Prev Graph buttons allow the user to quickly parse each graph. The Save Postscript saves the plot in a user specified file which the user can send to the printer.
The user can re-size the graph to any size and comparing multiple plots is accomplished by clicking on a second line in the Results window. Multiple plots in the same window is currently not supported.
This file last updated: Questions to: bionmrwebmaster@biochem.ualberta.ca