 |
orbplus Brian Sykes Lab |
 |
| |
orbplus Brian Sykes Lab |
|
Version: 1.0.6 - Aug 24 / 2010
Download and Installation
Purpose: Structural Feature Prediction Tool
First, the amino acid chemical shifts of the input protein are correlated and ranked against the target. Then, those amino acids with the highest correlation criteria are selected to predict an overall property value for the protein.
Although the software can do this calculation instantaneously, the usefulness of the software lies in the presentation of visual tools (spectral plots, chemical shift histograms, pymol modelling) which allow the user to confidently and quickly evaluate prediction results.
Copyright (C) 2010 - No portion of this program may be incorporated into other programs or sold for profit without express written consent of the authors.
This software written in tcl/tk is built as a self contained starkit which should make installation fairly trivial.
	gunzip orbplus-1.0-x.tar.gz
	tar xf orbplus-1.0-x.tar
or try double clicking the *.gz file on your desktop and see if the OS knows what to do.
For linux, click on the orbplus icon in the downloaded folder.
If orbplus did not start up, make sure you have the correct download. Quit the program and proceed to the Data Setup section.
Currently the software does not parse input files to determine the format. You must
specify the correct file suffix when entering data. If you forget to do this, then
orbplus will complain that it cannot figure out how to read your input.
It is not necessary to have all atoms assigned, the software only looks for the assigned
atoms. The default atom names are "HN", "H", and "N" (case does not matter). See the
Startup section if you are planning to work with
other atoms or atom names.
orbplus will accept the same input formats as the input data described above.
In the next section, we describe how we quantify the state change.
Defining and scoring regions requires a fair amount of expertise and insight from
the user. Other examples to examine include:
Here is a more formal explanation of the lines in this file:
MODEL is an arbitrary name for the experiment type, and PROTEIN is
the name of the protein.
Blank lines are ignored as well as lines which start with "#".
If you invoke orbplus via the command line then you have the choice of entering
command line arguments:
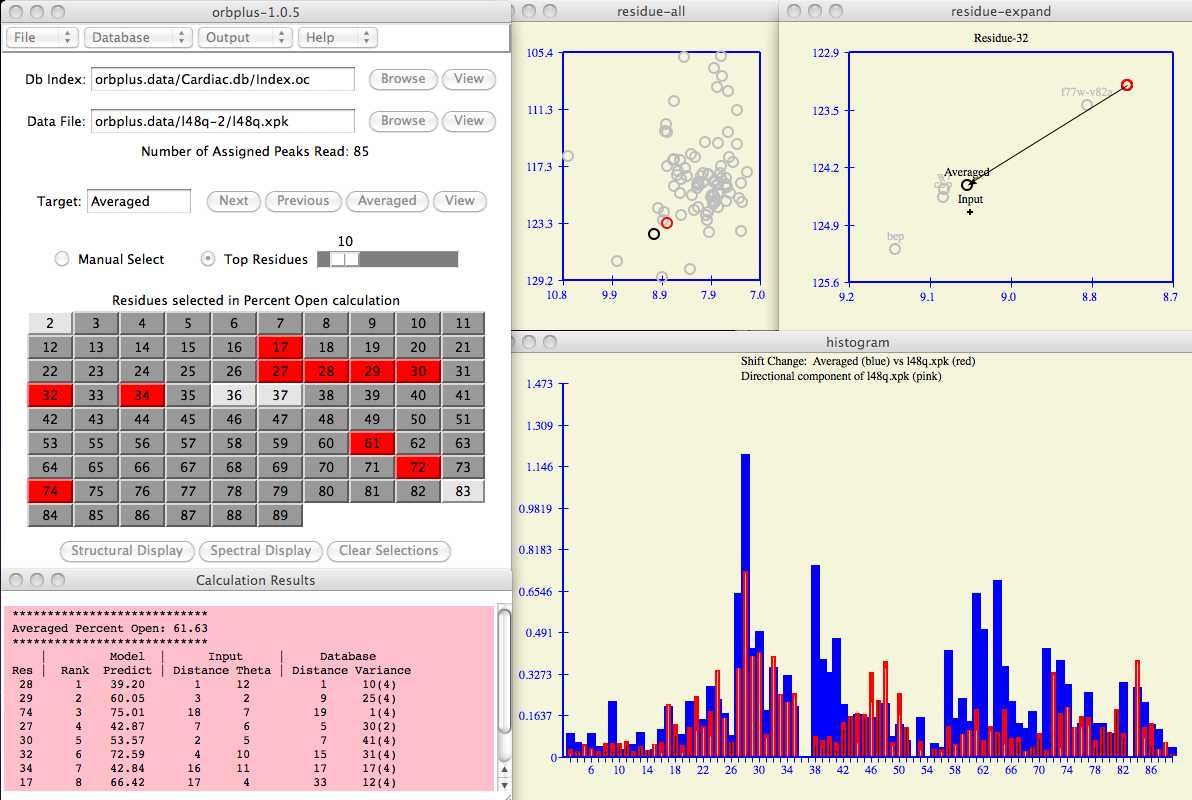
Enter the input protein and database index fields as shown in the example below.
Use the Browse button to search for these files on your computer if necessary.
In the example below, the database index file is found in
orbplus.data/Cardiac.db/Index.oc
and input protein chemical shifts are in
orbplus.data/l48q-2/l48q.xpk .
The diagram below shows the new target protein for residue 28 with the unselected
f77w-v82a protein in pink and the new value of the
Averaged chemical shift (compare with figure 4).
Users may also be interested in the role an individual protein target
contributes to the residue selection of the
prediction calculation .
The following set of buttons allow the user to cycle the database
(eg, Next, Previous or return to Averaged) to get
more insight in the residue ranking process.
All calculations and windows are updated automatically.
The colors blue and red indicate the magnitude of the chemical shift change of the
target and input protein respectively. The white and black lines found within each
histogram bar signify the direction of the input protein chemical shift with respect
to the target protein. White is a
positive correlation, black is negative. In the example below, one can see regions of
large chemical shifts with high correlation (ie, residues 27-35)
but perhaps not surprisingly there are regions of anti-correlation (ie, 38-51)
which may also have statistical and structural significance.
The chemical shift profile as depicted in the histogram can provide interesting
trends and insights as the user cycles through the database of
target proteins .
For example, the profile of the l48q input with the f77w-v82a
database protein
is strikingly different than the Averaged or other target proteins
(compare figures 8 and 9).
Press the Structural Display button to see a spatial respresentation of the
selected residues on a pdb structure. Unless you have copied the pdb file to your
current working directory, the software allows you to browse the computer to find the
file. If you have a pdb structure, now is a good time to analyze the relevance
of the residues selected in the prediction calculation.
Residues are ranked on the following criteria.
The residues are ranked from best to worst in each criteria
and a residue selection table similar to the one below is shown.
Columns 4 - 7 respectively reflect the criteria mentioned above.
The overall rank of a residue (see column 2) is calculated as
a weighted average of the individual ranks of columns 4 - 7.
Unless explicitly set in the
defaults file
each criteria carries equal weighting.
Column 3 is an estimate of the percent open score calculated as the
component of the input close/open vector projected onto the target vector.
Column 8 is the number of chemical shift data available in the target protein
for computing the variance.
As further explanation, here is an example of how one can analyze the above table.
Residue 29 is ranked #1 because 3+2+9+5=19 and residue 28 is next at
1+12+1+31=45. Although residue 28 has the greatest chemical shift change, it is
somewhat penalized for the variance (31/82) of its chemical shifts in the Averaged target
protein. Also of note is residue 27 which only has two
assigned chemical shifts in the Averaged target protein and
they are not close together (66/82).
Note that comparing the variance of populations of unequal sample size involves
multiplying by the appropriate t Distribution value.
The overall Percent Open value as shown on the main panel (see figure 2)
is a simple unweighted average of column 3 in the residue selection table.
Data Setup
There are several ways to configure data for this software.
For new users, you should download download and untar the
data and examples
directory to follow the examples presented here.
> mkdir l48q-1
> mkdir Cardiac.db
	# Title for modelling this activity change
	MODEL Percent Open

	# database entries (only 2)

	PROTEIN     w7
	STATE1      closed.xpk      1-45:0 46-90:50
	STATE2      w7.xpk          1-45:50 46-90:90
	END

	PROTEIN     bep
	STATE1      closed.xpk      1-45:0 46-90:50
	STATE2      bep.xpk         1-45:100 46-90:100
	END
In the example above we have chemical shifts for 2 different proteins in closed
and open states. It is believed that residues 46-90 of the closed state wild type
protein (closed.xpk) are somewhat more open than the 1-45 residue region. W7 is
more open and Bep (bepridil) is completely open. It is the job of the user to define the
interesting regions within a protein and to quantify the differences between STATE1
and STATE2. In the above example, a completely closed structure is scored 0 and completely
open is scored 100.
	MODEL  title
	PROTEIN  name
	STATE1 file_name residue_range:score residue_range:score ...
	STATE2 file_name residue_range:score residue_range:score ...
	END
Startup
As mentioned in the installation, the user can click on the orbplus icon
or invoke orbplus from a terminal window.
orbplus [-defaults defaultsFile] [-db dbIndexFile] [-data InputFile]

	defaultsFile: custom program preferences file.
	dbIndexFile: database index file as described in data setup section
	inputFile: input data to analyze
The advantage of the command line is that you can specify the inputs and customize
the software for specific environments. Here is a commented version from
l48q-2/defaults . In
this example we have told the program where to find input/output and tweaked some
of the graphic attributes. Creating a
startup script
within each data directory is a good way document various orbplus runs.
To find out the majority of options which can be changed see the current version of the
defaults file usually found in
lib/defaults of the software installation directory.
A table of defined color names can be found at
http://www.tcl.tk/man/tcl/TkCmd/colors.htm and a starting point for font
selection is search 'xlsfonts' in your web browser.
Input
This section is required if you have not told orbplus where to find the input
data via the defaults file as described above.
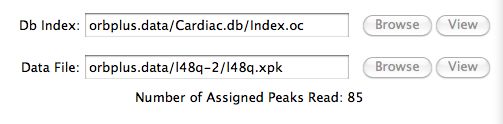 Figure 1
The Residue Tableau
After the software successfully reads in the input, it
places all the residues in the target protein in a tableau
and hilites those residues (in red) which are determined as being the best for prediction
purposes. See the prediction calculation section
for the details on how this is done.
The residues in light grey are
residues with incomplete assignment information and therefore
can not be selected. For example, a chemical shift assigned in the open chemical
shift file may not be assigned in the corresponding closed one.
The user typically clicks (or drags) the Top Residues scrollbar to
increase/decrease the number of residues
selected in the
prediction calculation .
A user may be more interested to manually select these residues
in which case one clicks the Manual Select radio button. For example,
the user would like to see how all the data from a region in the sequence
compares with the software's ranking of best residues.
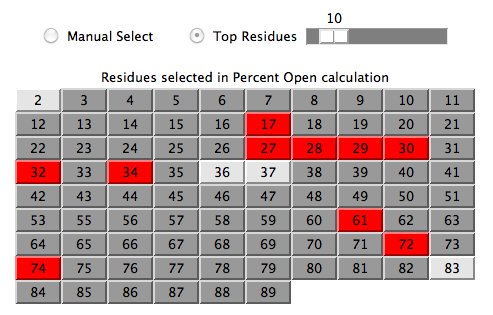 Figure 2
Calculation Results
As residues are selected/unselected, users will see a summary of how each residue
contributes to the overall prediction score.
A full explanation of this table is given in the
prediction calculation section.
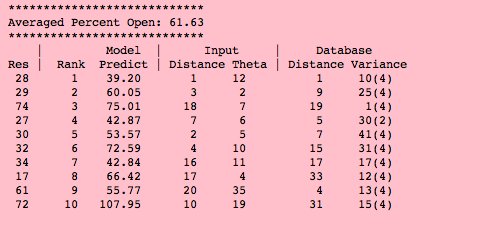 Figure 3
Spectral Plots
Clicking on any residue in the residue tableau updates the two (simulated)
spectral windows for that residue.
The vector between the red circle and black circle of both spectral plots indicates the
chemical shift change from closed to open state of the target protein.
The expanded spectral window shows the input protein chemical shift and
how selected individual database proteins (in grey) contribute to an Averaged
chemical shift of the target protein.
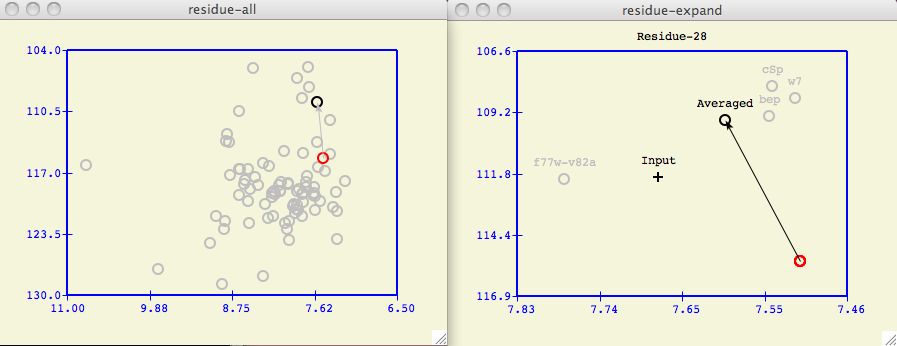 Figure 4
The Target Protein
Often it is insightful to change which proteins in the database are included in
the formation of the target protein. For example, in the spectral plot above a
user may wonder if the f77w-v82a protein unduly biases
the calculated Averaged chemical shift.
Under the Database menu in the main
orbplus window, the user can checkmark the proteins to use in the database.
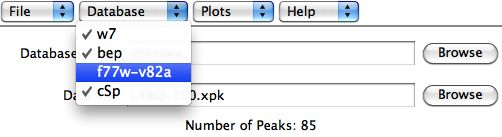 Figure 5
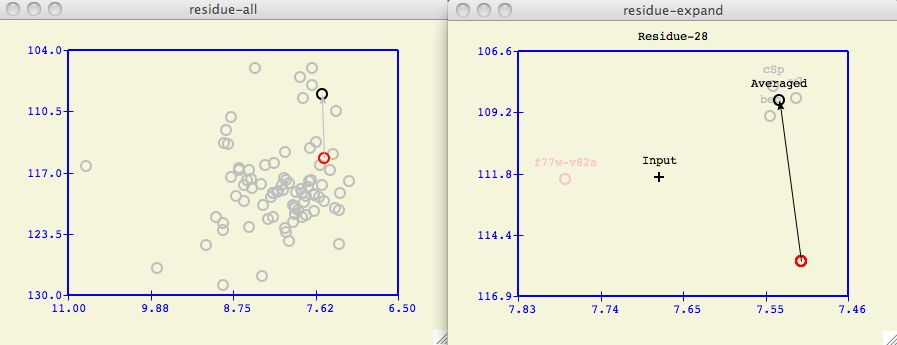 Figure 6
The above figure shows the best residues to use when W7 is selected to be
the target protein (compare with the Averaged target protein in Figure 2).
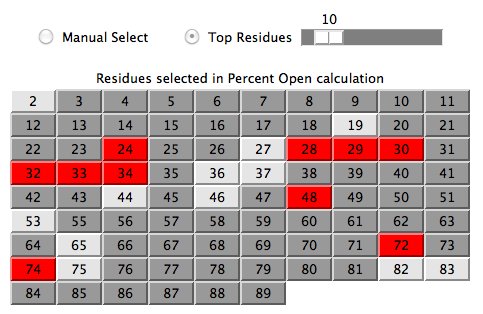 Figure 7
The Chemical Shift Profile Histogram
The histogram attempts to summarize the information contained in each expanded
spectral plot for all residues.
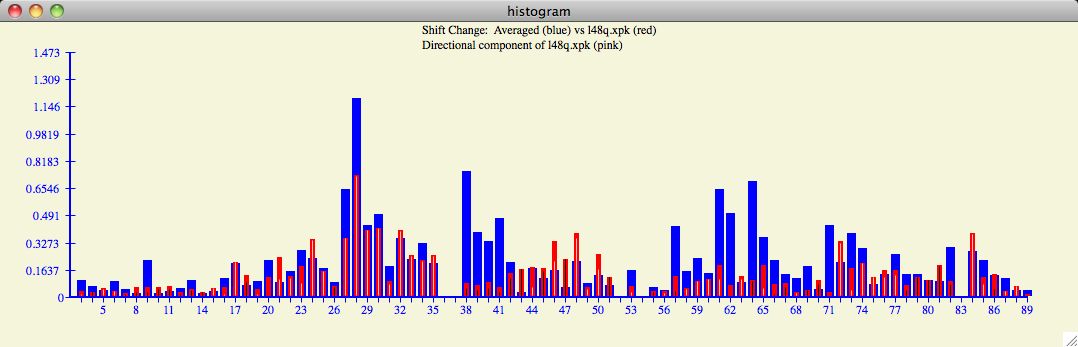 Figure 8
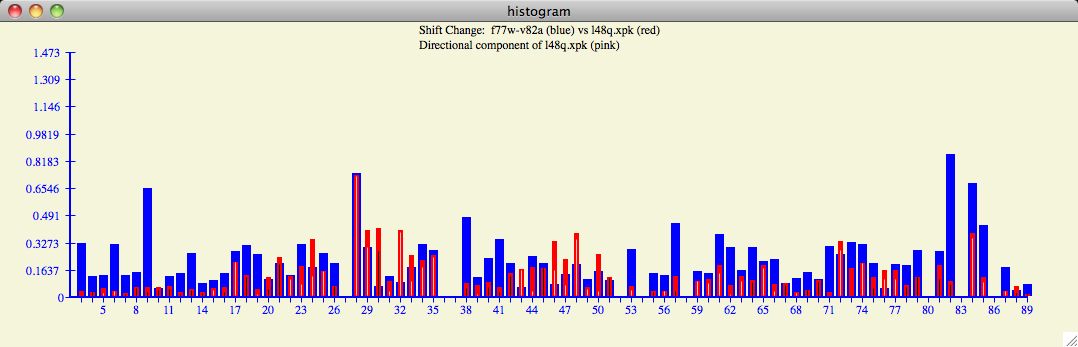 Figure 9
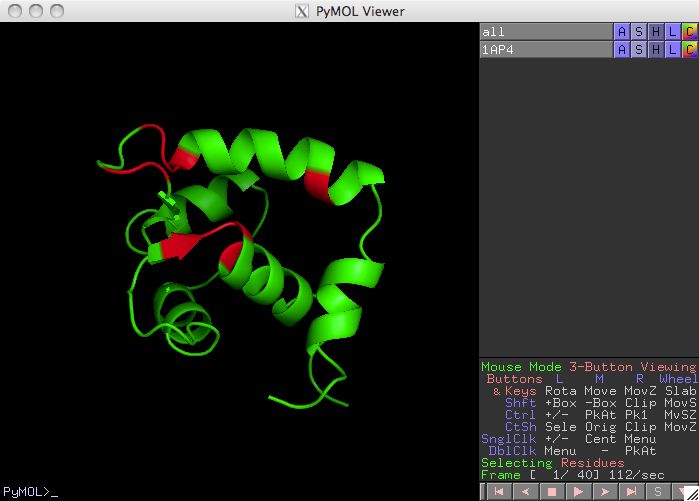
Display Residues in pymol
The default location for the structural display software is in
/usr/local/bin/pymol . A user that prefers pymol to be
in a different location should use a custom defaults file like
l48q-2/defaults or change
lib/defaults of the orbplus installation.
Prediction Calculation
orbplus will attempt to estimate the close/open property of an input
protein by comparing the corresponding chemical shifts from a subset of residues
in the target protein. First, the software attempts to rank the residues from best
to worst predictive value to aid in the residue selection process.
The user will then decide how many top residues to include or perhaps use the
information provided to manually make a different selection.
Figure 10
Future Development and Conclusions
Questions