This example demonstrates the use of smartnotebook when the cctocsy experiment data is also available.
	> cd hsqc-cctocsy
	> snbview
	When nmrview comes up, type "snb" at the nmrview console.
To configure snb for cctocsy data all you need to do that is different from basic setup is select "Spectral Configuration 2 of 4" in the "Initialization procedure (2 of 6)". . When you do this you will notice that the next screen will prompt the user to enter a cctocsy.xpk and cctocsy.nv file as shown.
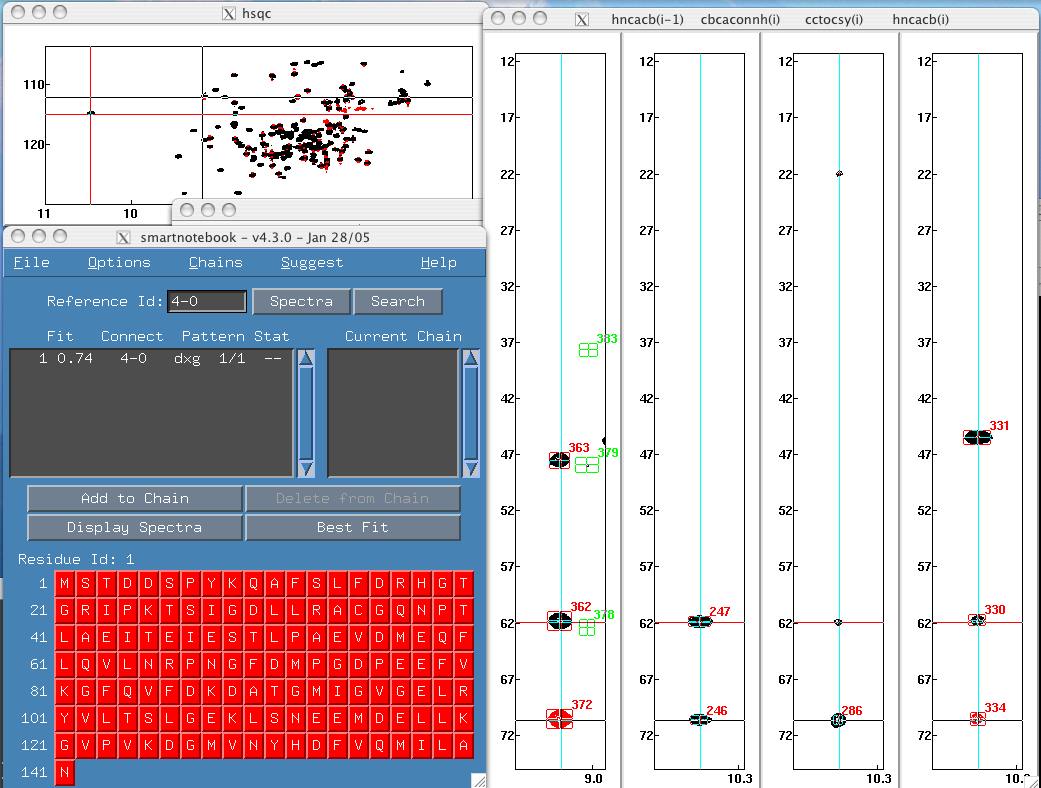
It does not matter how well you peakpick the cctocsy spectra. If you look at the database rule files in lib/experiments/triple-res/hsqc-2.rules you will see that the cctocsy peakpicks are not used for determining connectivities. Why make connectivity searching more complicated than it already is for the peakcon software? So the only reason we include cctocsy.xpk is strictly for the benefit of displaying peak labels in nmrview. As an exercise, try displaying the "4-0" connectivity and turn peak labelling on (options menu). You will see that one of the peaks in the cctocsy is not picked but it does not affect connectivity choices. Note: Set the vertical scale threshold lower for the cctocsy data via the Options/Vertical Scale menu item.
As a visual aid for the user, the cctocsy spectra can be very helpful. Most spectroscopists will appreciate the extra information to help evaluate connectivities. Perhaps there are other processed data sets which would be interesting to include in a similar fashion? Please let me know your ideas.
This file last updated: Questions to: bionmrwebmaster@biochem.ualberta.ca