Let's go through what each field in the connection record means:
The first field is an integer (1-9) which indicates how well the shifts in this connectivity, when added to the current chain, fit somewhere in the sequence. Given the current default values, a score of 1 means one of the shifts has a test stat > 1.5. A score of 2 means one of the shifts has a test stat > 0.75, a score of 3 means at least one of the shifts has a test stat score > 0.375, etc. As you can see, this allows the user to quickly evaluate a connectivity based on closeness of fit to the shift constraints file. Certainly the more accurate your shifts constraints file is, the more interesting this fit score becomes in chain construction decisions.
The second field is a fitting score (or probability score) which indicates how well all the peaks in the pattern line up. The connectivity patterns in this panel are sorted from highest to lowest based on this field. A score near 0.0 means that one or more peaks is quite close to the allowable error tolerance for a valid peakpick pattern. The user should carefully examine any low scoring connection which is being considered for chaining. Perhaps an overlapping peak has made it difficult for the peak picking software to determine where a particular peak center is located. A score of 1.0 is perfection, all peak centers of the peak pattern line up exactly. In reality, almost all good connectivity patterns score in the range of 0.4 to 0.8.
In the default settings, the "Pattern" field contains one of four basic sequential connectivity patterns in the experiment sets of the current smartnotebook.
Here "residue" is defined as not a glycine or prolene. If the user has defined his/her own connectivity files, then other customized patterns will also show up here.
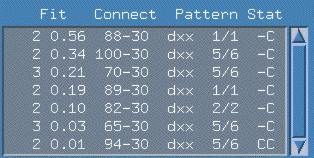
In the example above, you can see that the 100-30 connectivity is located in an area of peak overlap where 6 possible interpretations are possible. The 5th interpretation (in the connectivity file) is the one that we are considering. Connectivities with no ambiguity are specified as 1/1 .
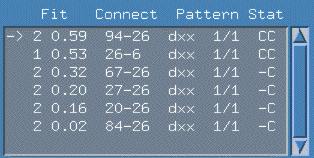
Look at the example figure above. You can see that reference IDs 94 and 30 are currently being used in chain construction. The other reference Ids are not being used and no reference Id in this list has been assigned yet.
Question: What does it mean when the connection panel is empty yet I am expecting a connection? See Missing Connections .
This file last updated: Questions to: bionmrwebmaster@biochem.ualberta.ca