 |
orbplus Brian Sykes Lab |
 |
| |
orbplus Brian Sykes Lab |
|
Version: 1.1.2 - Jul / 2011
Download and Installation
Purpose: Structural Feature Prediction Tool
This software summarizes and predicts the properties of an input protein using only the assigned chemical shift information of a target protein. Examples of such properties include:
The target protein may be a single protein selected from a database of proteins where the property in question is known or estimated. The target protein may also be an averaged protein derived from the selection of several proteins from the database.
First, the amino acid chemical shifts of the input protein are correlated and ranked against the target. Then, those amino acids with the highest correlation criteria are selected to predict an overall property value for the protein.
Although the software can do this calculation instantaneously, the usefulness of the software lies in the presentation of visual tools (spectral plots, chemical shift histograms, pymol modelling) which allow the user to confidently and quickly evaluate prediction results.
Authors and References: Robertson, IM, Boyko, RF, and Sykes, BD (2011) Visualizing the principal component of 1H,15N-HSQC NMR spectral changes that reflect structural or functional properties of a protein: Application to troponin C. J. Biomol. NMR (in press).
Copyright (C) 2010 - No portion of this program may be incorporated into other programs or sold for profit without express written consent of the authors.
> cd
> mkdir orbplus_test
Currently the software does not parse input files to determine the format. You must specify the correct file suffix when entering data. If you forget to do this, then orbplus will complain that it cannot figure out how to read your input.
It is not necessary to have all atoms assigned, the software only looks for the assigned atoms. The default atom names are "HN", "H", and "N" (case does not matter). See the Startup section if you are planning to work with other atoms or atom names.
# DB Index file for use in orbplus
MODEL:      Interhelical Angle
# key       short_name  file_name               residue_range:score_range ...
REFERENCE:  Ca          nhsqc_Ca.xpk            90-125:111-119 126-160:113.5-118.25
PROTEIN:    cRp40       nhsqc_cRp40.xpk         90-125:79-87 126-160:83-91
PROTEIN:    EGCg        nhsqc_EGCg.xpk          90-125:104-114 126-160:106-118
PROTEIN:    EMD         nhsqc_EMD.xpk           90-125:90-98 126-160:107-119
Users need to decide where the interesting regions are and appropriate scores. There is no limit to the number of residue_range:score_range terms where each term is separated by whitespace. Blank lines in the file are ignored as well as lines which start with "#". Other examples of Db Index files include Cardiac.db/orbplus_oc.index and Cardiac.db/orbplus_iha.index.
The simplest solution is not to worry about settings, just double click on the green ball orbplus icon or execute a startup script from a terminal window. But if you want the software to automatically find the data, taylor windows, colors, fonts for your screen, set plotting attributes, etc then you should understand the options on how to do this.
orbplus [-defaults defaultsFile] [-db dbIndexFile] [-data InputFile] [-pymol pdbFile] [-output outputDir]

	defaultsFile: application defaults file
	dbIndexFile: database index file
	inputFile: input data to analyze
	pdbFile: input structure file for pymol to display
	outputDir: where to direct all output from this software
	(linux) alias orbplus $HOME/Desktop/orbplus/orbplus
	(macosx) alias orbplus $HOME/Desktop/orbplus.app/Contents/MacOS/orbplus
The following orbplus.defaults example shows how to control window size and placement, colors, input, output, and other variables for your particular needs.
If orbplus has any problems starting up see the
orbplus.log file.
A table of defined color names can be found at
http://www.tcl.tk/man/tcl/TkCmd/colors.htm and a starting point for font
selection is searching "xlsfonts" in your web browser.
Enter the input protein and database index fields as shown in the example below.
Use the Browse button to search for these files on your computer if necessary.
In the example below, the database index file is found in
Cardiac.db/orbplus_oc.index
and input protein chemical shifts are in
Cardiac.db/l48q.xpk .
The software prints the number of assigned peaks read as notice to the user that
the input file was correctly parsed.
To check if the chemical shift files on the database were read correctly,
view the orbplus.log file
in the Output->Show log file menu item.
The Next, Previous and Averaged buttons allow the user
to cycle the database to see how
the input protein compares with various target proteins.
The figure below shows how the Residue Tableau is updated
when W7 (a specific protein in our database) is selected to be
the target protein.
The following figure indicates the top 10 residues for a given target protein. How
the software ranks the residues is explained in the
prediction calculation section.
The user typically clicks (or drags) the Top Residues scrollbar to
increase/decrease the number of residues
selected.
A user may be very interested to manually select the residues
in which case one first clicks the Manual Select radio button and
then clicks the desired residue boxes. All calculations and spectral plots
are updated on the fly.
A full explanation of the columns in this table is given in the
prediction calculation section.
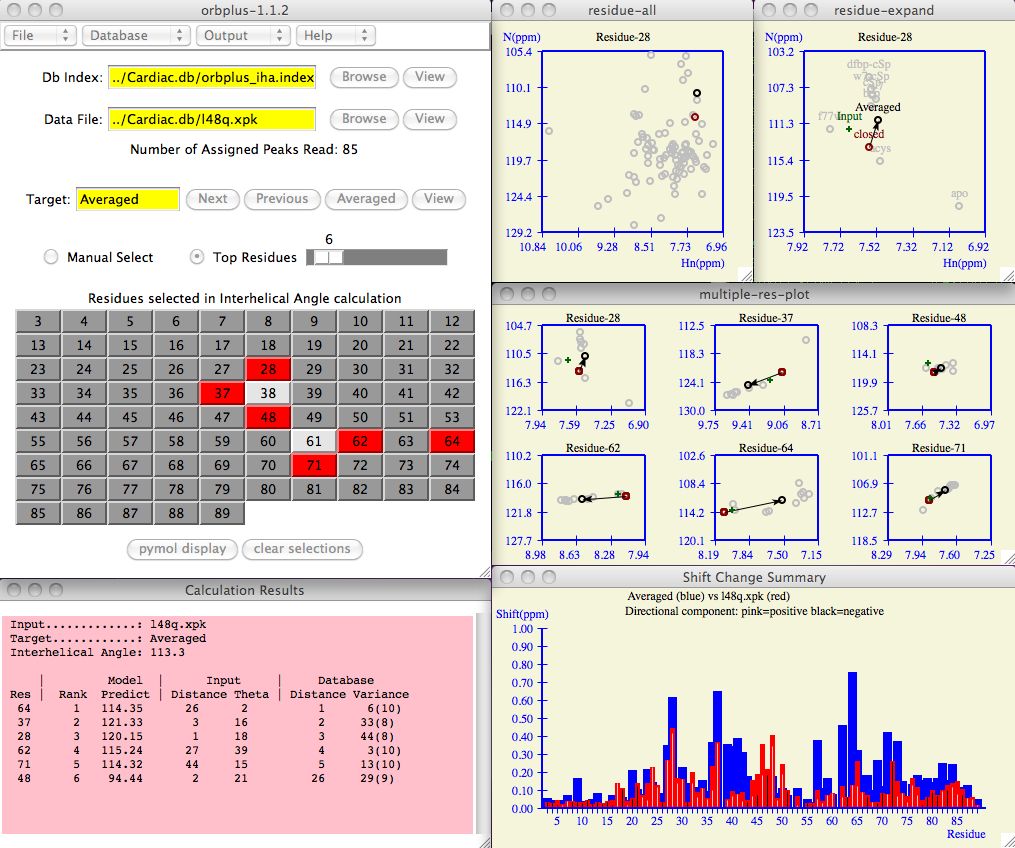
The residue-all window shows all the chemical shifts for all the residues in the
target protein. The black circle depicts the positioning of the current residue, the
red circle are the chemical shifts for the reference protein for the current residue.
The residue-expand window shows all the chemical shifts for one residue only.
Again, the red circle are the chemical shifts for the reference protein,
the black circle are the chemical shifts of the target protein.
The gray circles are the other possible target proteins and the plus sign depicts
the chemical shifts of the Input protein.
Any pink circles (eg, f77w and apo) are the chemical shifts of
proteins which have been temporarily excluded from the database
(see Database Customization section).
The multiple-res-plot combines the information in one residue-expand plot
for all the residues hilited in the Residue tableau . It is a way to view
chemical shifts of several residues all at once. Because screen space is
likely a premium, the user may want to keep this window in icon form.
Each residue consists of a black/white bar contained within a red bar contained
within a blue bar.
Residues which do not have all the required shift information are not included.
The blue bar indicates the magnitude of the chemical shift of the
target protein with respect to the reference protein. The red bar is the magnitude
of the chemical shift change of the input protein with respect to the reference
protein.
The white or black bar found within each
histogram bar signifies the direction of the input protein chemical shift with respect
to the target protein. White is a
positive correlation, black is negative.
In the example below, one can see regions of
large chemical shifts with high correlation (ie, residues 27-35)
but perhaps not surprisingly there are regions of anti-correlation (ie, 38-51)
which may also have statistical and structural significance. It is interesting
to note the general ebb and flow of chemical shift change throughout various regions
of this particular input protein.
The chemical shift profile as depicted in the histogram can provide interesting
trends and insights as the user cycles through the database of
target proteins .
For example, the profile of the l48q input with the f77w-v82a
database protein
is strikingly different than the Averaged or other target proteins.
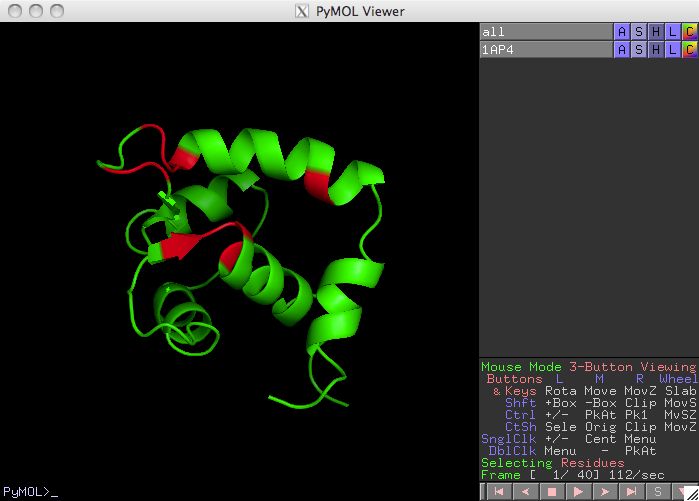
Press the Structural Display button to see a spatial respresentation of the
selected residues on a pdb structure. Unless you have copied the pdb file to your
current working directory, the software allows you to browse the computer to find the
file. If you have a pdb structure, now is a good time to analyze the relevance
of the residues selected in the prediction calculation.
The residues are ranked from best to worst using each of the following criteria:
For those residues which have reference chemical shifts,
we can define corresponding chemical shift vectors for both the input
and target proteins. Trigonometry can now be used to calculate the component
of the input vector projected onto the target vector.
The Model Predict value is the reference value score (eg, interhelical angle)
plus a term where term is the difference between
reference and target scores multiplied by the calculated component.
The overall Rank of a residue (see column 2) is calculated as
a weighted average of the above criteria. Unless explicitly set in the
defaults file
each criteria carries equal weighting.
For example, residue 64 is ranked #1 because 26+2+1+6=35 and residue 37 is next at
3+16+2+33=54.
The variance orbplus uses to rank the database entries; is this simply
determined by summing the standard deviations in the x and y coordinates between all
entries and then subsequently ranked by lowest overall standard deviation?
Yes, except all entries are scaled first so that the averaged vector is the same length
for each residue. If you don't do this, then you bias your results to select residues
that are not undergoing any change. Scaling does have the effect of magnifying the
measurement error so the smaller residue shifters are negatively biased.
How is the Averaged chemical shift vector calculated?
The averaged chemical shift vector for a particular residue is the average
of all the N and Hn shift values for all the available and active data for that residue
in the database.
Discussion
Prediction calculation at this stage in orbplus is a simplification
and is basically a starting point for the user to explore chemical shift patterns
that are correlated/anti-correlated with structure. For this reason, calculating the
error in the prediction would be virtually meaningless. orbplus is a
visualization tool and hopefully the presentation of basic but reasonable criteria
combined with residue locality and user knowledge leads to effective insights.
For a discussion of how orbplus and PLS regression analysis compare,
please see the orbplus publication.
Input Panel
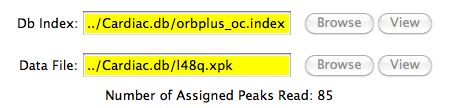 Figure 1
The Target Protein
The target protein may be a single protein selected from a database of proteins
or it may be an averaged protein derived from the selection of
several proteins from the database. Unless the user decides otherwise, the default
target protein is the averaged protein.
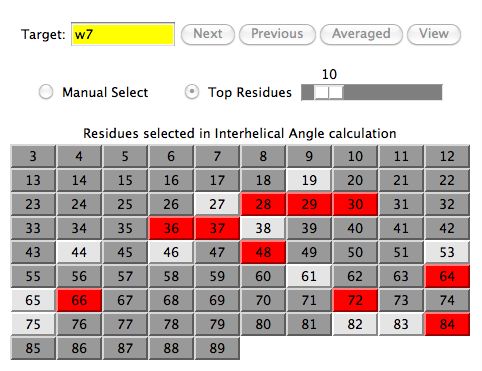 Figure 2
The Residue Tableau Panel
The residue tableau indicates those residues
which are currently being used in the
prediction calculation (hilited in a red background)
and those that are not (hilited with a dark gray background).
The residues in the light gray background (eg, 38, 61) are
residues with incomplete assignment information and therefore
can not be selected. For example, a chemical shift assigned in one chemical
shift file may not be assigned in the corresponding referenced one.
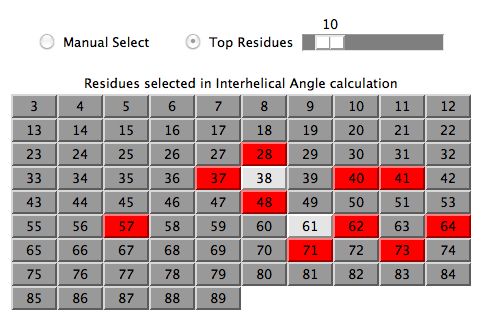 Figure 3
Calculation Results Window
As residues are selected/unselected, users will see a summary of how each residue
contributes to the overall prediction score (eg, Interhelical Angle).
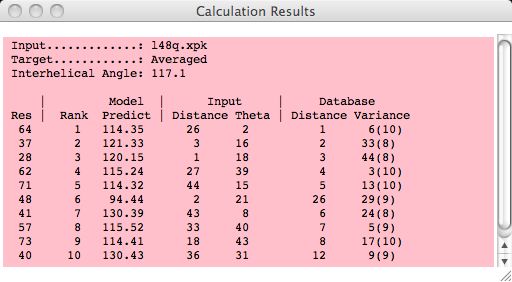 Figure 4
Spectral Plots
Clicking on any residue in the residue tableau updates the residue-all
and residue-expand spectral windows for that residue.
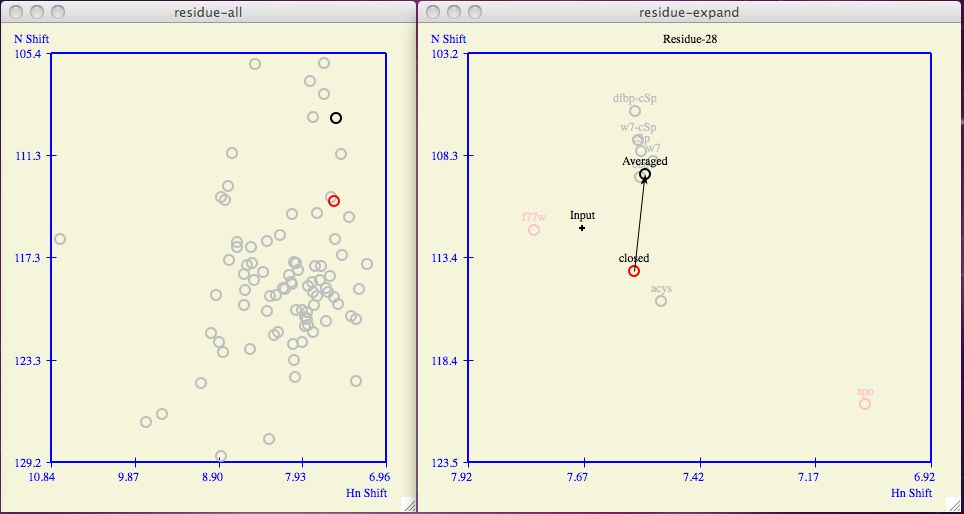 Figure 5
Note: All spectral plots can be resized either manually or by clicking the
maximize/un-maximize button.
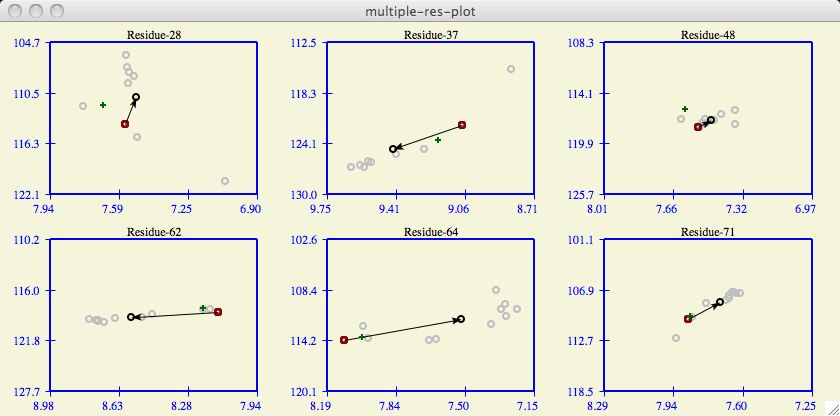 Figure 6
The Chemical Shift Profile Histogram
The profile histogram is an interesting way to summarize the change in chemical shift
for all residues. Note that calculating changes in chemical shift includes the
multiplicative factor which equalizes the importance of the chemical shift atoms
(eg, HN and N).
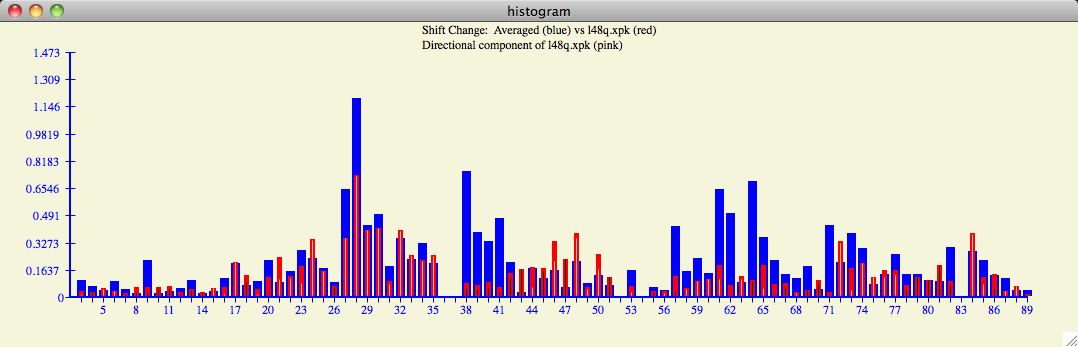 Figure 7
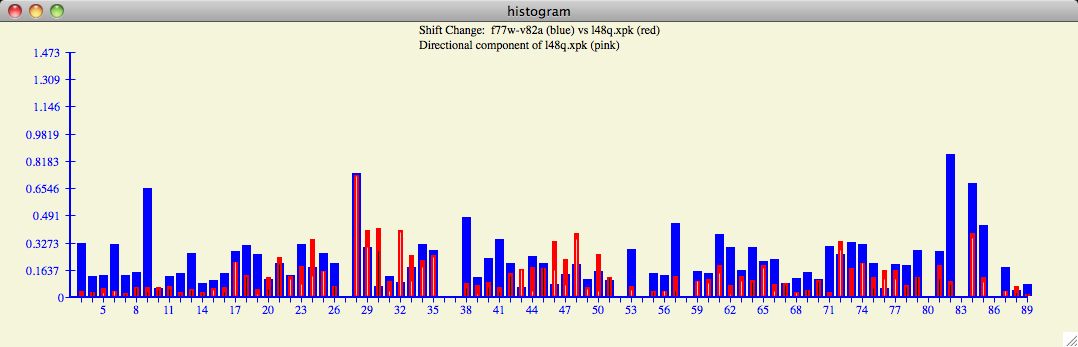 Figure 8
Display Residues in pymol
The default location for the structural display software is in
/usr/local/bin/pymol . A user that prefers pymol to be
in a different location should use a custom defaults file like
l48q-pymol/orbplus.defaults .
The orbplus.defaults file also contains other defaults related to the
formation of the pymol script.
Figure 9
Database Customization
Often it is insightful to change which proteins in the database are included in
the formation of the averaged target protein.
Under the Database menu in the main
orbplus window, the user can checkmark the proteins to use in the database.
A change in the protein database automatically updates the Averaged protein and all
affected calculations and plots.
For example, we can see the affects of the removal of f77w and apo
on the Averaged protein chemical shifts in figure 4.
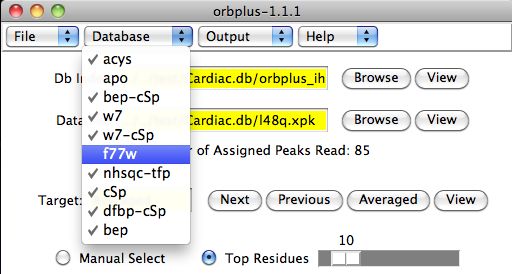 Figure 10
Prediction Calculation
orbplus will attempt to estimate a property (eg, open/close value) of an input
protein by comparing the corresponding chemical shifts from a subset of residues
in the target protein. First, the software attempts to rank the residues from best
to worst predictive value to aid in the residue selection process.
The user will then decide how many top residues to include or perhaps use the
information provided to manually make a different selection. Once the residues are
selected as displayed in the Calculation Results window, the final prediction
(eg, interhelical angle) is the average of the Model Predict column.
Figure 11
Appendix 1: Troubleshooting